Creating Powerful Stock Screeners in Trade Labs
Learn how to build and use stock screeners in Trade Labs to find trading opportunities across multiple instruments based on your strategy's performance.
Creating Powerful Stock Screeners in Trade Labs
Stock screeners are essential tools for traders and investors looking to identify opportunities across a wide range of instruments. In this guide, we'll walk through how to create and use screeners in Trade Labs to test your trading strategies across multiple stocks simultaneously.
What is a Stock Screener?
A stock screener is a tool that allows you to filter and analyze multiple stocks based on specific criteria. In Trade Labs, screeners go beyond simple fundamental or technical filters - they allow you to apply your custom trading strategies to multiple instruments at once, helping you discover which markets your strategy performs best in.
Why Use Screeners?
- Discover alpha opportunities across different market sectors
- Compare strategy performance across multiple instruments
- Identify sector rotation opportunities by seeing which sectors are outperforming
- Refine your trading strategy by understanding how it performs across different instruments
- Build diversified portfolios based on strategy performance metrics
Creating a Stock Screener in Trade Labs
Let's walk through the process of creating a stock screener step by step:
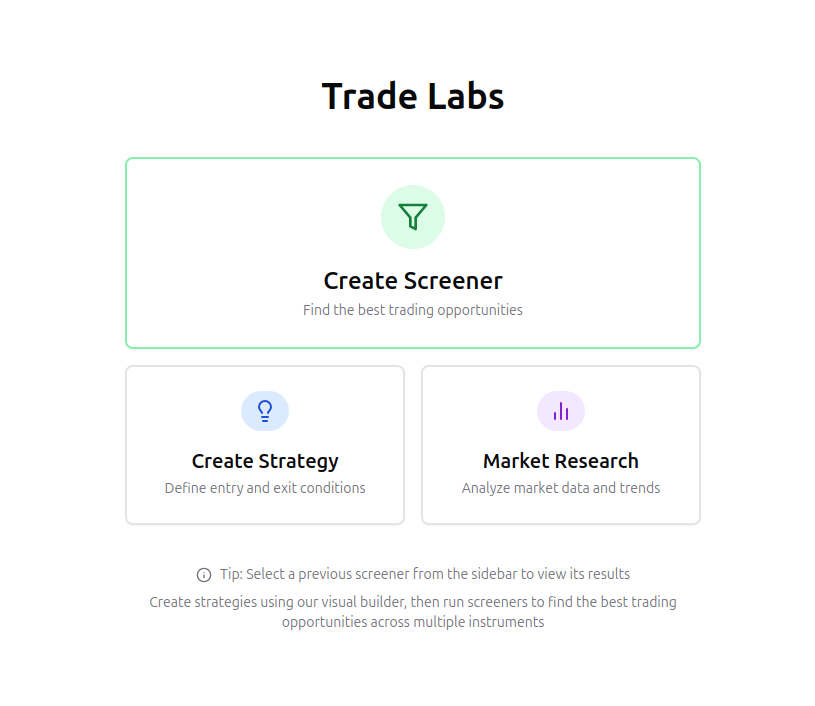
Step 1: Navigate to the Screeners Section
From your Trade Labs dashboard, select "Create New Screener."
Step 2: Name Your Screener
Give your screener a descriptive name that helps you remember its purpose, such as "SMA Crossover Strategy - Tech Stocks" or "RSI Oversold Bounce Screener."

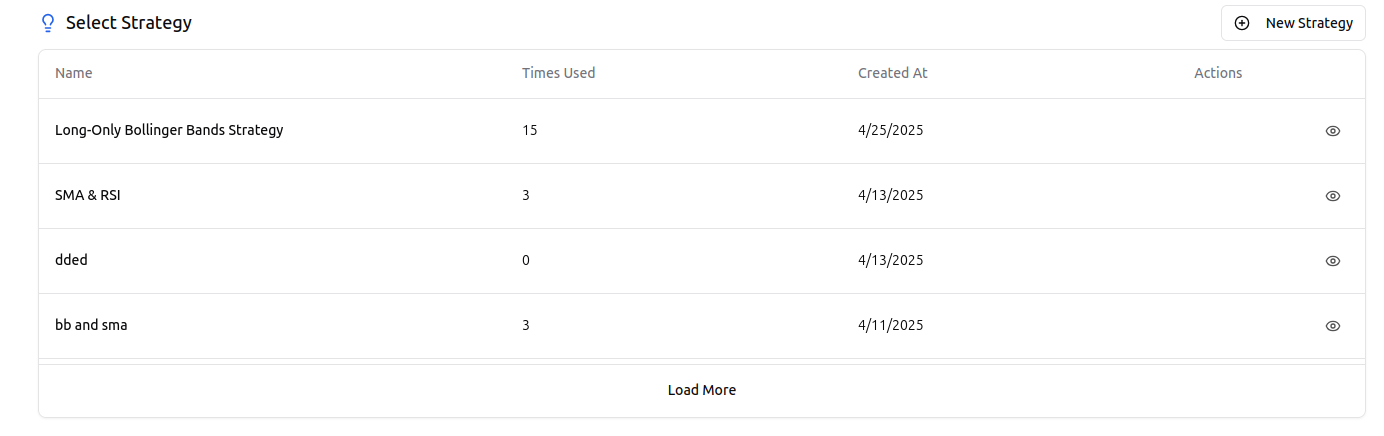
Step 3: Select a Trading Strategy
Choose from your existing strategies to apply to the screener. This is the strategy that will be backtested across all the instruments you select.
If you haven't created a strategy yet, you can click "New Strategy" to create one before continuing. Remember that a well-defined strategy with clear entry and exit rules will provide the most meaningful screening results.
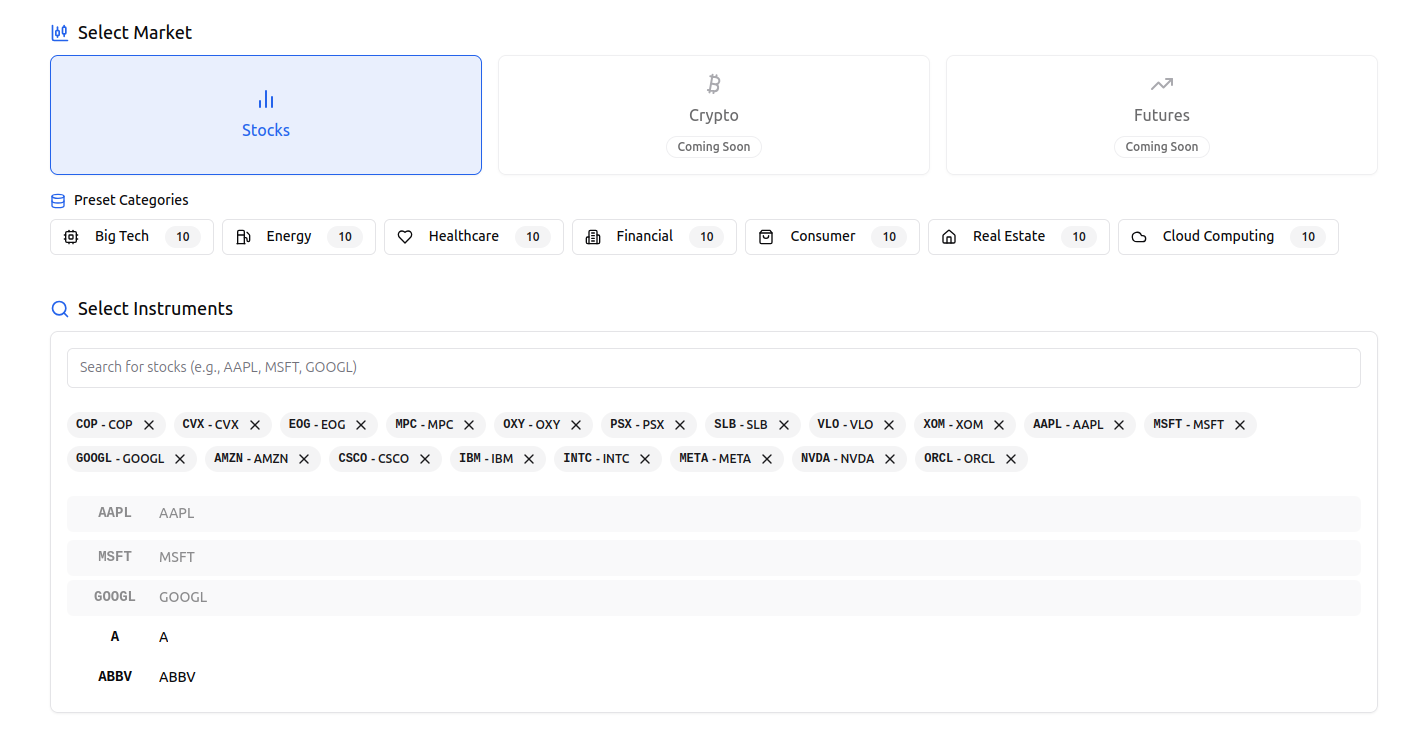
Step 4: Choose Market Type and Instruments
Select the market type (currently, Trade Labs supports stock screening with more markets coming soon). Then, choose the instruments you want to include in your screener:
- Use preset categories like "Big Tech," "Energy," "Healthcare," etc., to quickly add groups of related stocks
- Search for specific instruments by typing their ticker symbols or names
- Add instruments individually from the search results
You can add as many instruments as you want to your screener. The more instruments you add, the more comprehensive your results will be, but the longer the screening process will take.
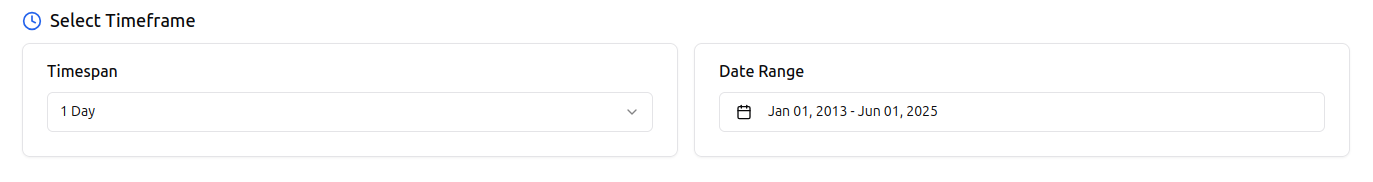
Step 5: Configure Timeframe and Date Range
Select the timeframe (1-minute, 5-minute, 15-minute, 1-hour, or 1-day) and date range for your backtest. This determines the granularity and historical period for your screener's analysis.
For longer-term strategies, a daily timeframe might be appropriate, while shorter-term strategies might benefit from minute or hourly data.
Step 6: Run the Screener
Click "Create Screener" to start the screening process. Trade Labs will backtest your strategy across all selected instruments and compile the results for your analysis.
Depending on the number of instruments, the timeframe, and the date range you've selected, the screening process may take a few minutes to complete.
Analyzing Screener Results
Once your screener has finished processing, you'll be presented with a comprehensive view of your strategy's performance across all the instruments you selected.
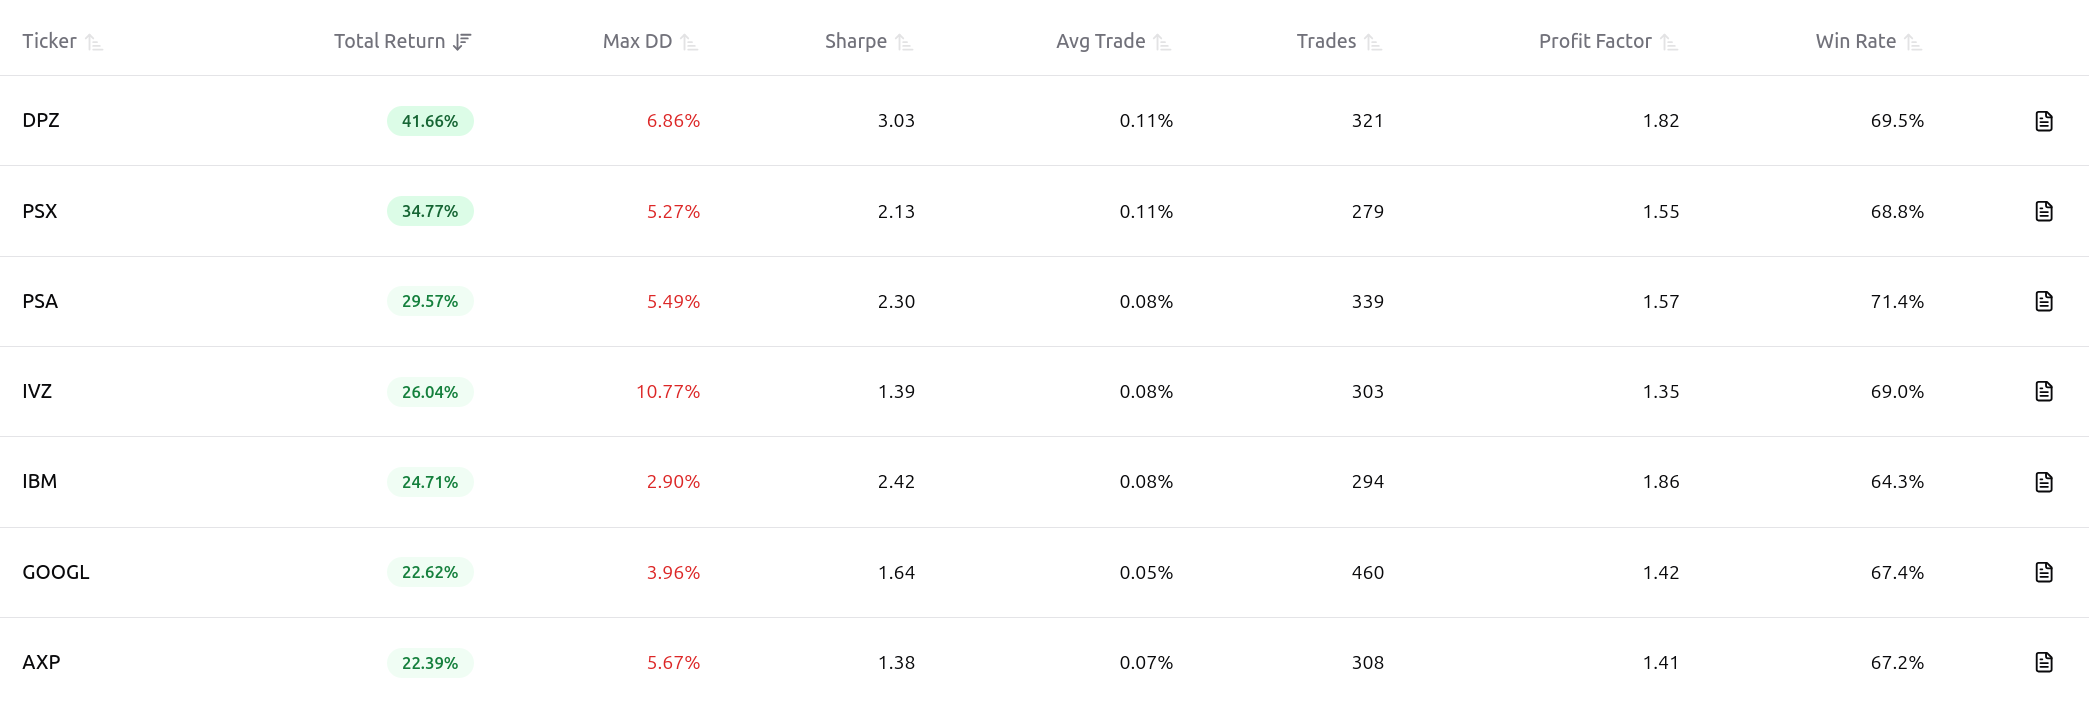
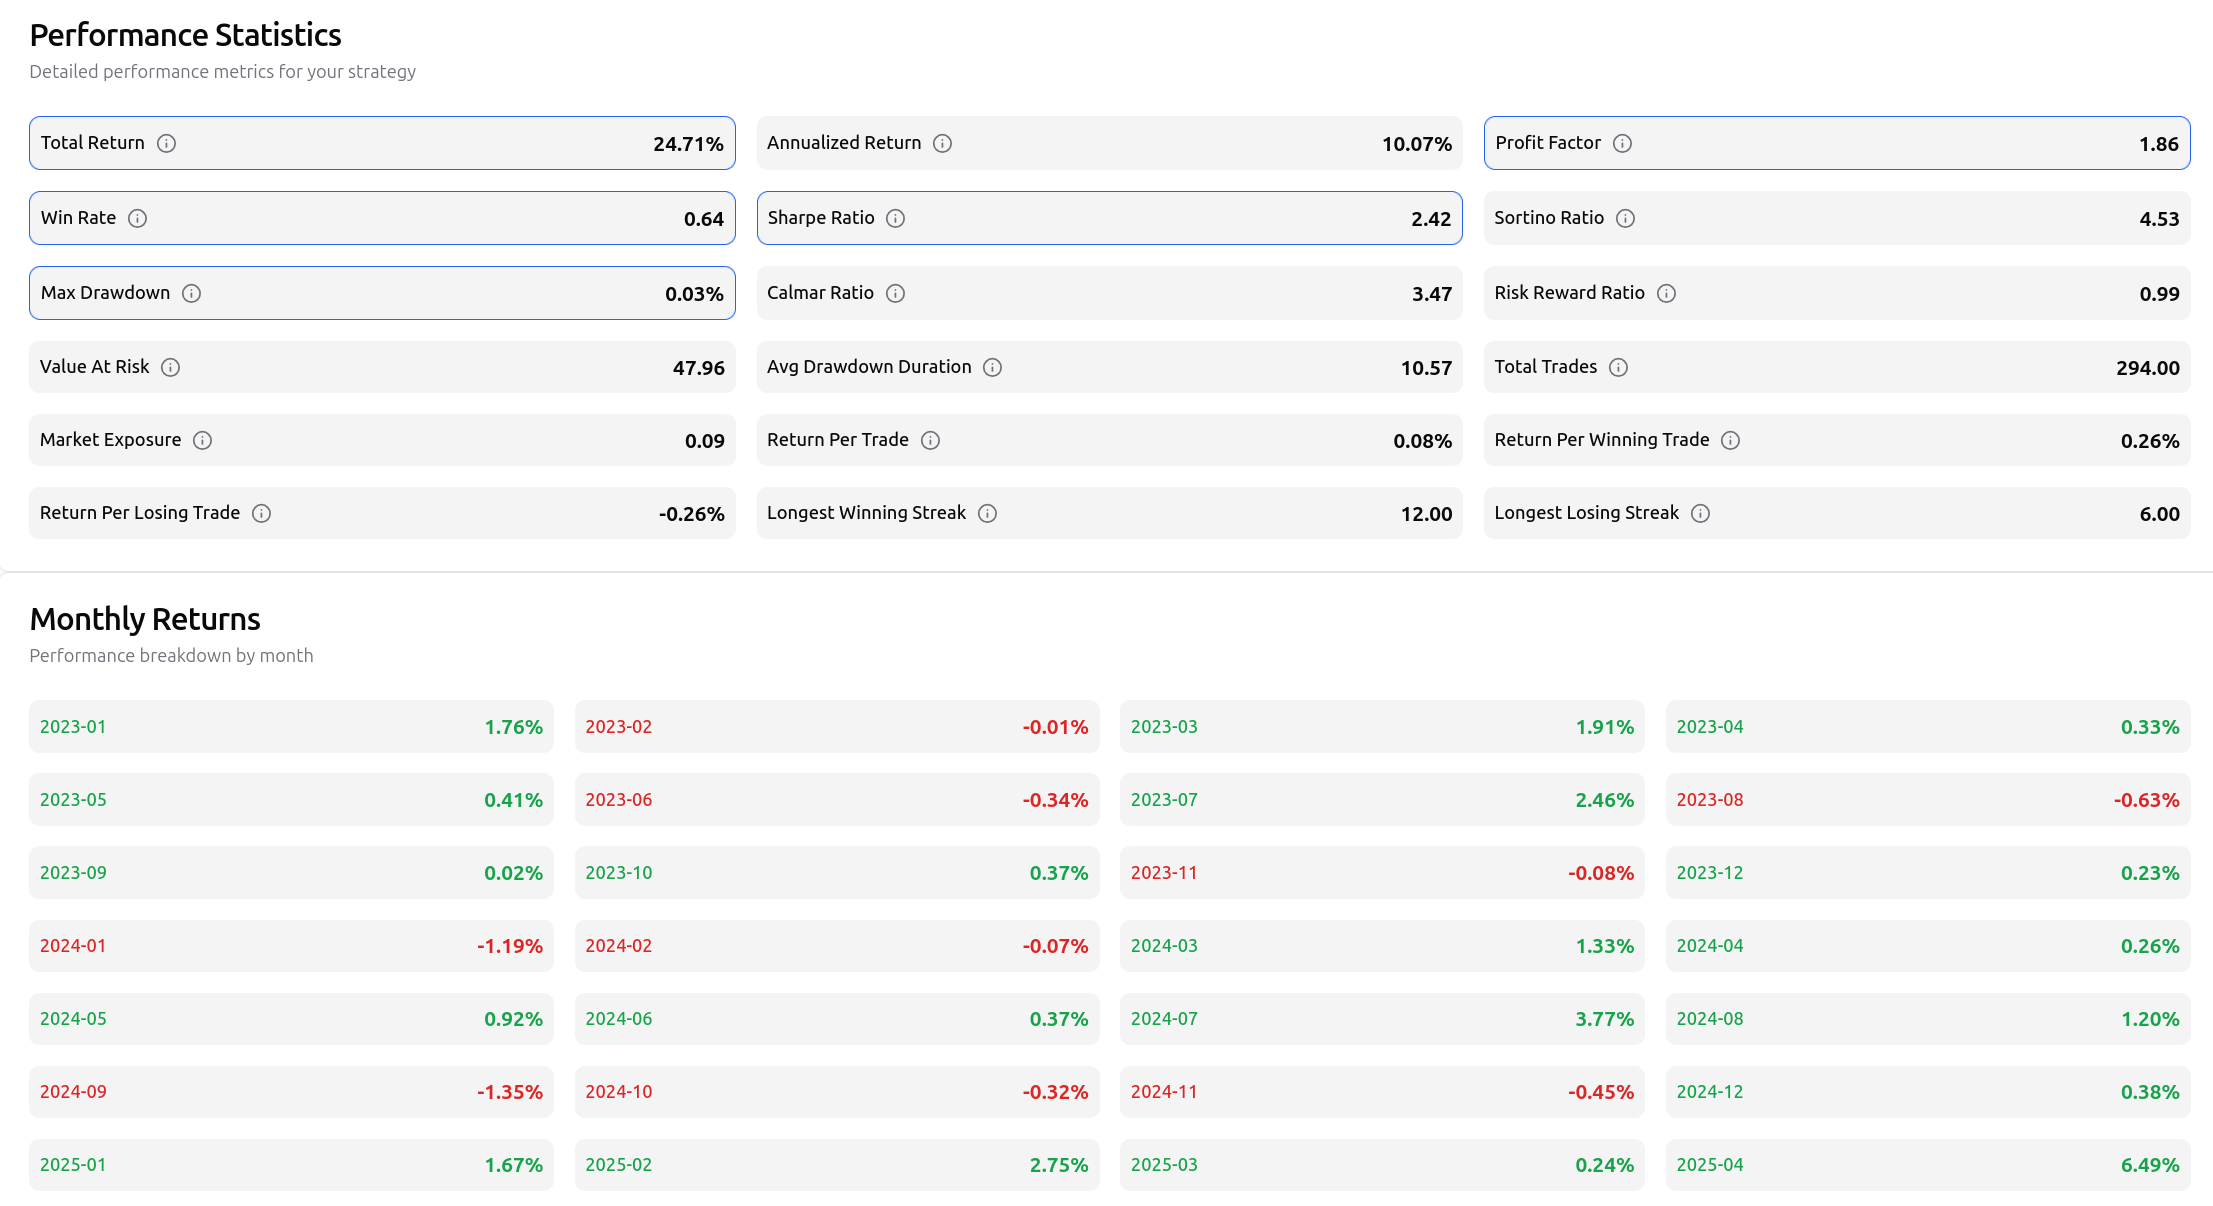
Performance Metrics Table
The results table shows key performance metrics for each instrument, including:
- Total Return: The overall percentage return of the strategy on each instrument
- Maximum Drawdown: The largest peak-to-trough decline in equity
- Sharpe Ratio: Risk-adjusted return metric
- Average Trade Return: The average return per trade
- Number of Trades: Total trades executed on each instrument
- Profit Factor: Gross profit divided by gross loss
- Win Rate: Percentage of profitable trades
You can sort the results table by any of these metrics to quickly identify the best and worst performing instruments for your strategy.
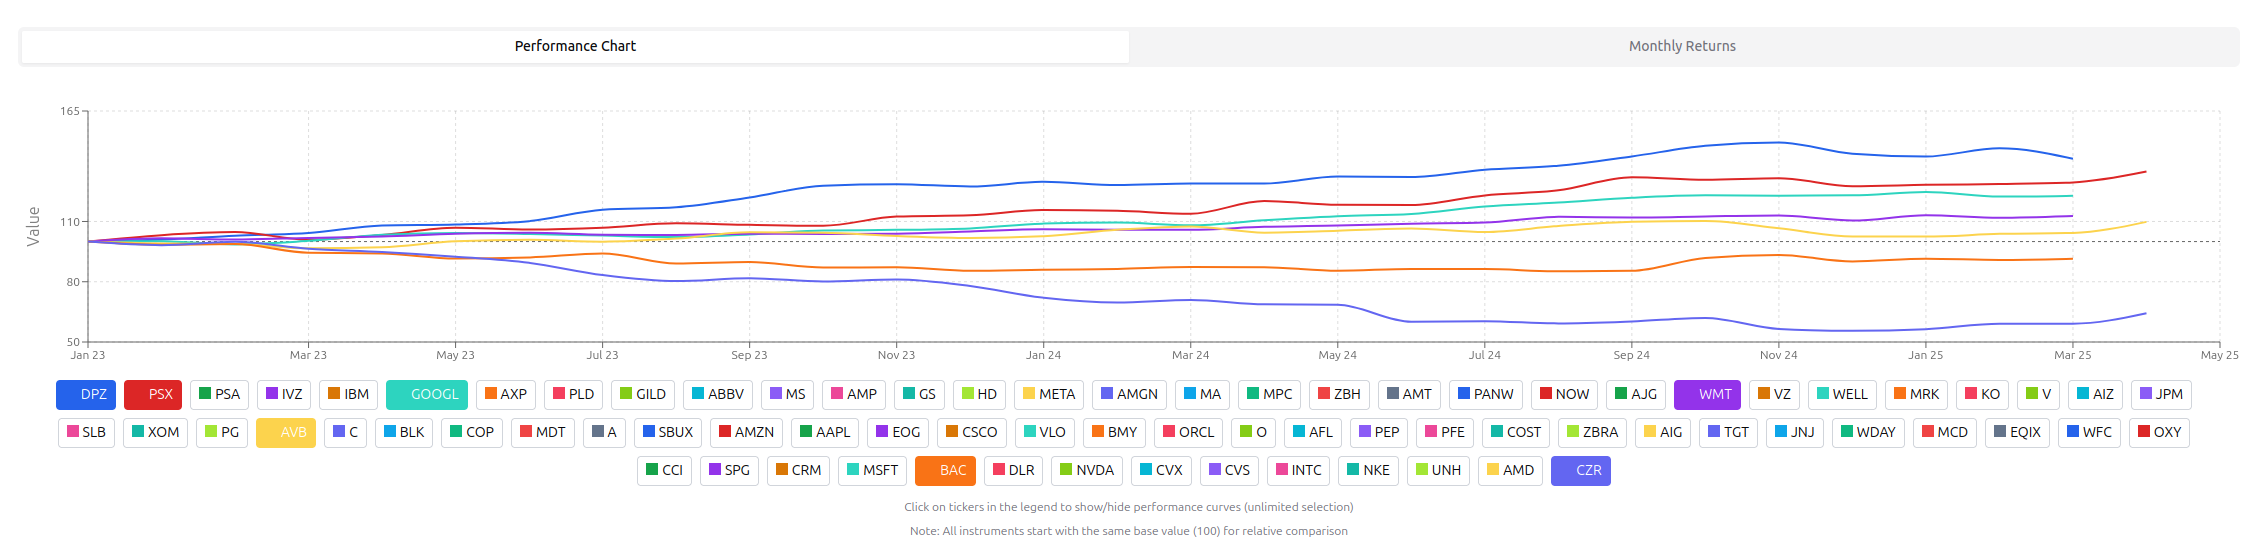
Performance Charts
Trade Labs provides visual performance analysis through interactive charts:
- Performance Chart: Displays the equity curves for selected instruments, allowing you to compare performance over time
- Monthly Returns: Shows month-by-month returns for selected instruments, helping you identify seasonal patterns or periods of outperformance
You can toggle instruments on and off in the legend to focus on specific comparisons.
Generating Detailed Reports
For any instrument that shows promising results, you can generate a detailed backtest report to analyze its performance more deeply. Simply click the report icon next to the instrument in the results table.
This detailed report provides:
- Trade-by-trade analysis
- Advanced performance metrics
- Drawdown analysis
- Trade distribution statistics
- Monthly and daily performance breakdowns
Practical Screener Use Cases
Sector Rotation Strategy
- Create a screener with instruments from different sectors (Technology, Energy, Healthcare, etc.)
- Apply a momentum-based strategy to identify which sectors are showing strength
- Sort results by total return to see which sectors your strategy performs best in
- Adjust your trading focus to the top-performing sectors
Finding the Best Instruments for Your Strategy
- Create a screener with a large basket of instruments (e.g., S&P 500 components)
- Apply your trading strategy and sort by Sharpe ratio or profit factor
- Focus your trading on the instruments that show the highest risk-adjusted returns
- Create a watchlist of the top 10-20 instruments for daily monitoring
Strategy Optimization Through Comparative Analysis
- Create multiple screeners using variations of your strategy (different parameters)
- Run each screener on the same basket of instruments
- Compare the overall performance to determine which strategy variation works best
- Implement the best-performing variation in your live trading
Best Practices for Effective Screening
- Start with a clearly defined strategy: Make sure your strategy has well-defined entry and exit rules before screening.
- Test across diverse instruments: Include instruments from different sectors and with different characteristics.
- Use appropriate timeframes: Match your screening timeframe to your trading timeframe.
- Consider sufficient history: Include both bull and bear market periods in your date range for robust results.
- Focus on risk-adjusted returns: Sort by metrics like Sharpe ratio rather than just total return.
- Look for consistency: The best instruments will show consistent performance across multiple metrics.
Conclusion
Stock screeners in Trade Labs provide a powerful way to identify trading opportunities and refine your strategies. By applying your custom trading rules across multiple instruments, you can discover where your strategy works best and build a portfolio of instruments that align with your trading approach.
Remember that past performance doesn't guarantee future results, but a well-designed screener can significantly improve your chances of finding profitable trading opportunities in the markets.
Start creating your own screeners today and unlock new dimensions of market analysis in your trading journey with Trade Labs.